Creating a Dashboard
To create a new dashboard, click on the Create Dashboard button on the top right corner of the dashboards view.Editing a Dashboard
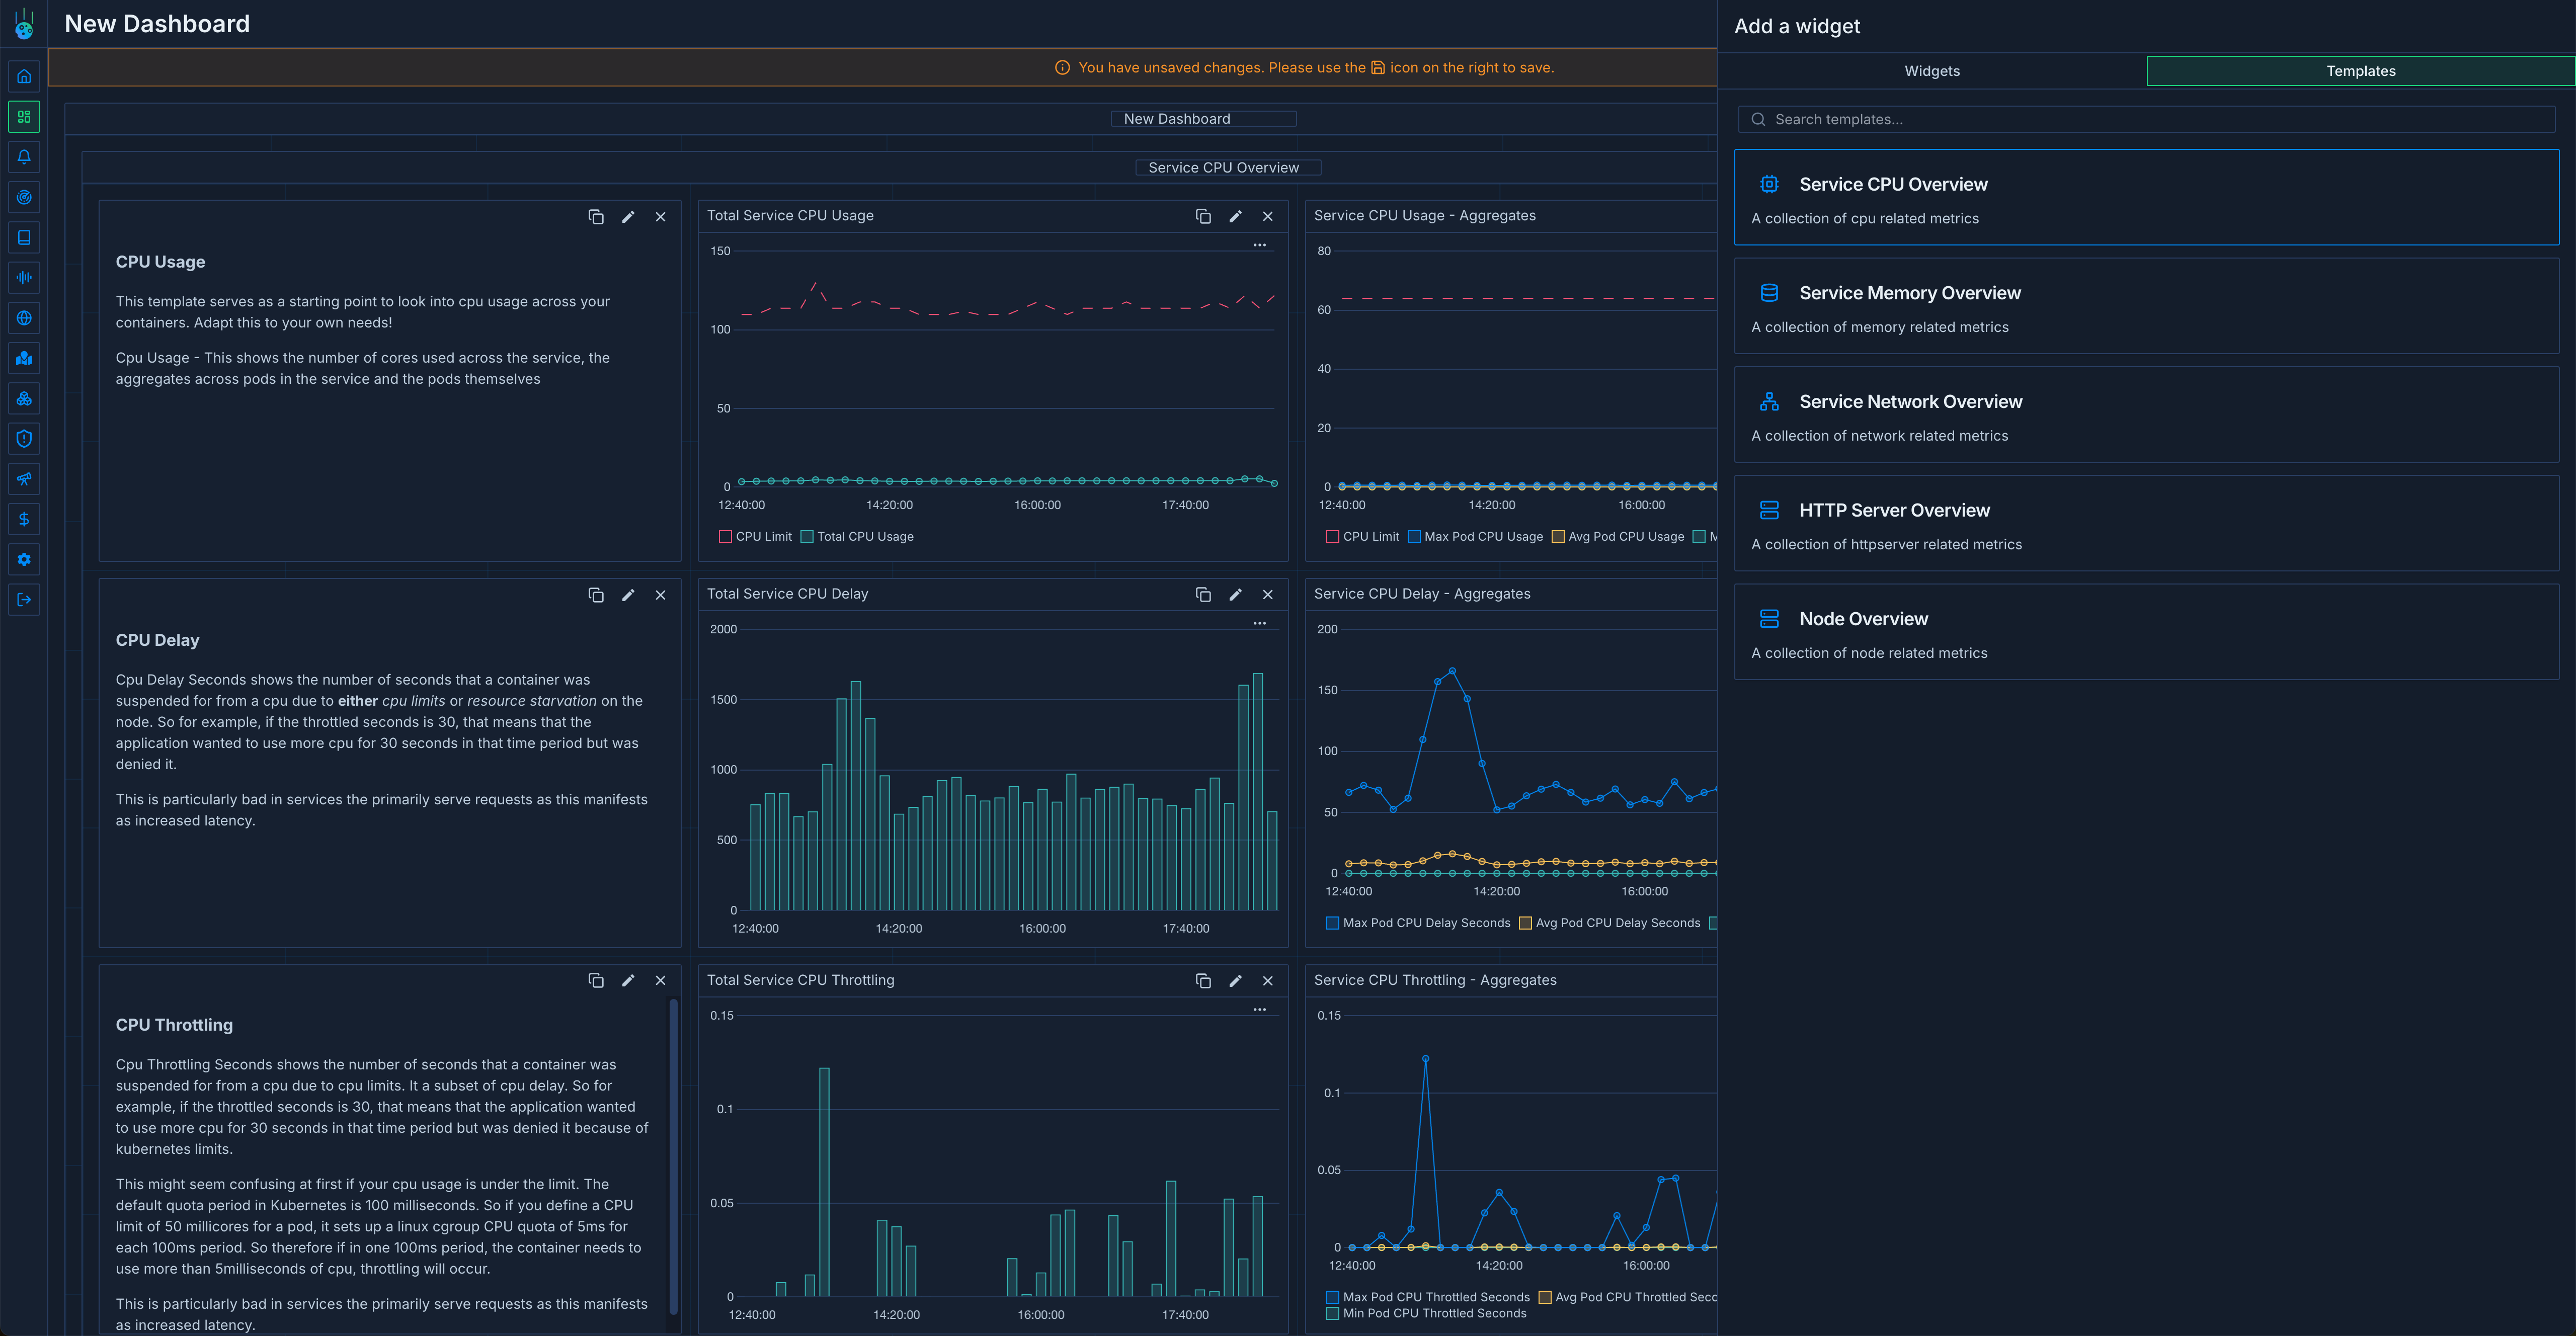
To edit a dashboard, click on the Edit button on the dashboard card. You can add new charts and groups by clicking the Add widget button on the dashboard view. When creating a new chart, you’ll run through the chart creation wizard where you can search for metrics, select aggregations and filters, and customize the chart appearance.Using Predefined Dashboard Templates
Metoro provides a set of predefined dashboard templates to help you get started quickly. These templates are designed to cover common monitoring scenarios and can be easily customized to fit your needs.Available Templates
- CPU Node Overview: Provides detailed insights into CPU usage and performance metrics across your nodes
- HTTP Server Metrics: Monitors HTTP server performance, including request rates, latencies, and error rates
- Network Overview: Visualizes network traffic, bandwidth usage, and connectivity metrics
- Node Overview: Comprehensive view of node health and performance metrics
- Service Memory Overview: Tracks memory usage and allocation patterns across your services
Using Templates
- Click on the Create Dashboard button
- Select “Use Template” from the creation dialog
- Choose your desired template from the available options
- The template will be imported with pre-configured widgets and variables
- Customize the dashboard as needed for your specific use case
Importing and Exporting Dashboards
You can also import existing dashboard configurations or export your dashboards as JSON:- To import: Use the dashboard settings to import a JSON configuration
- To export: Access the dashboard settings and select the export option to download the dashboard configuration as JSON