
Status Pages
Status pages provide a way to communicate your service’s health and incidents to your users. You can create multiple status pages for different audiences or services. Each public status page automatically refreshes every minute. A small indicator in the top right shows how many seconds remain until the next refresh.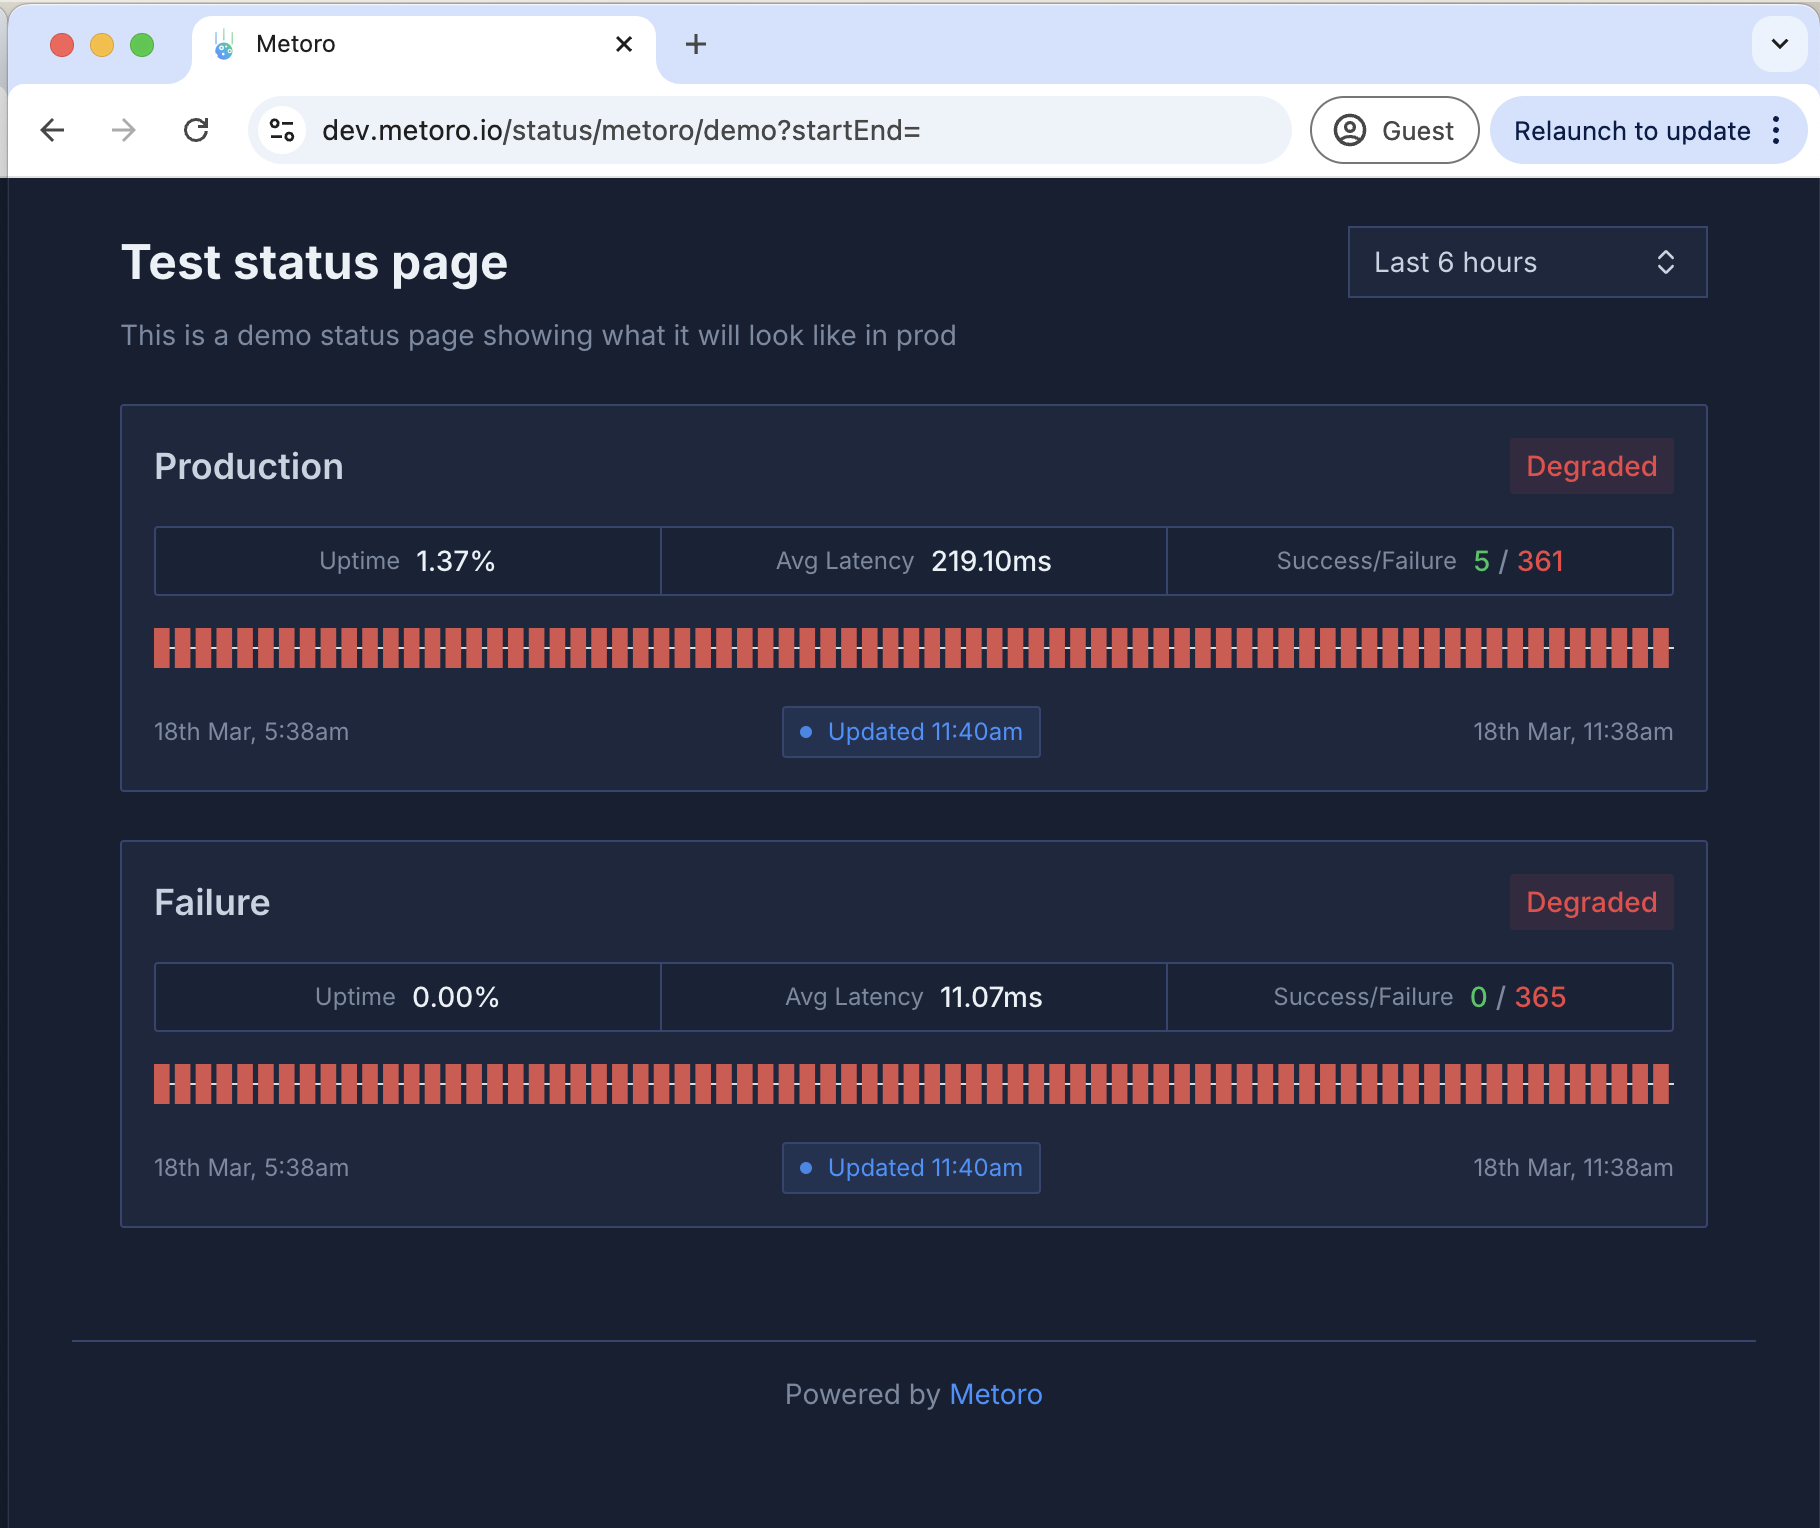
Creating a Status Page
- Navigate to the Settings page in your Metoro dashboard
- Select the “Integrations” tab
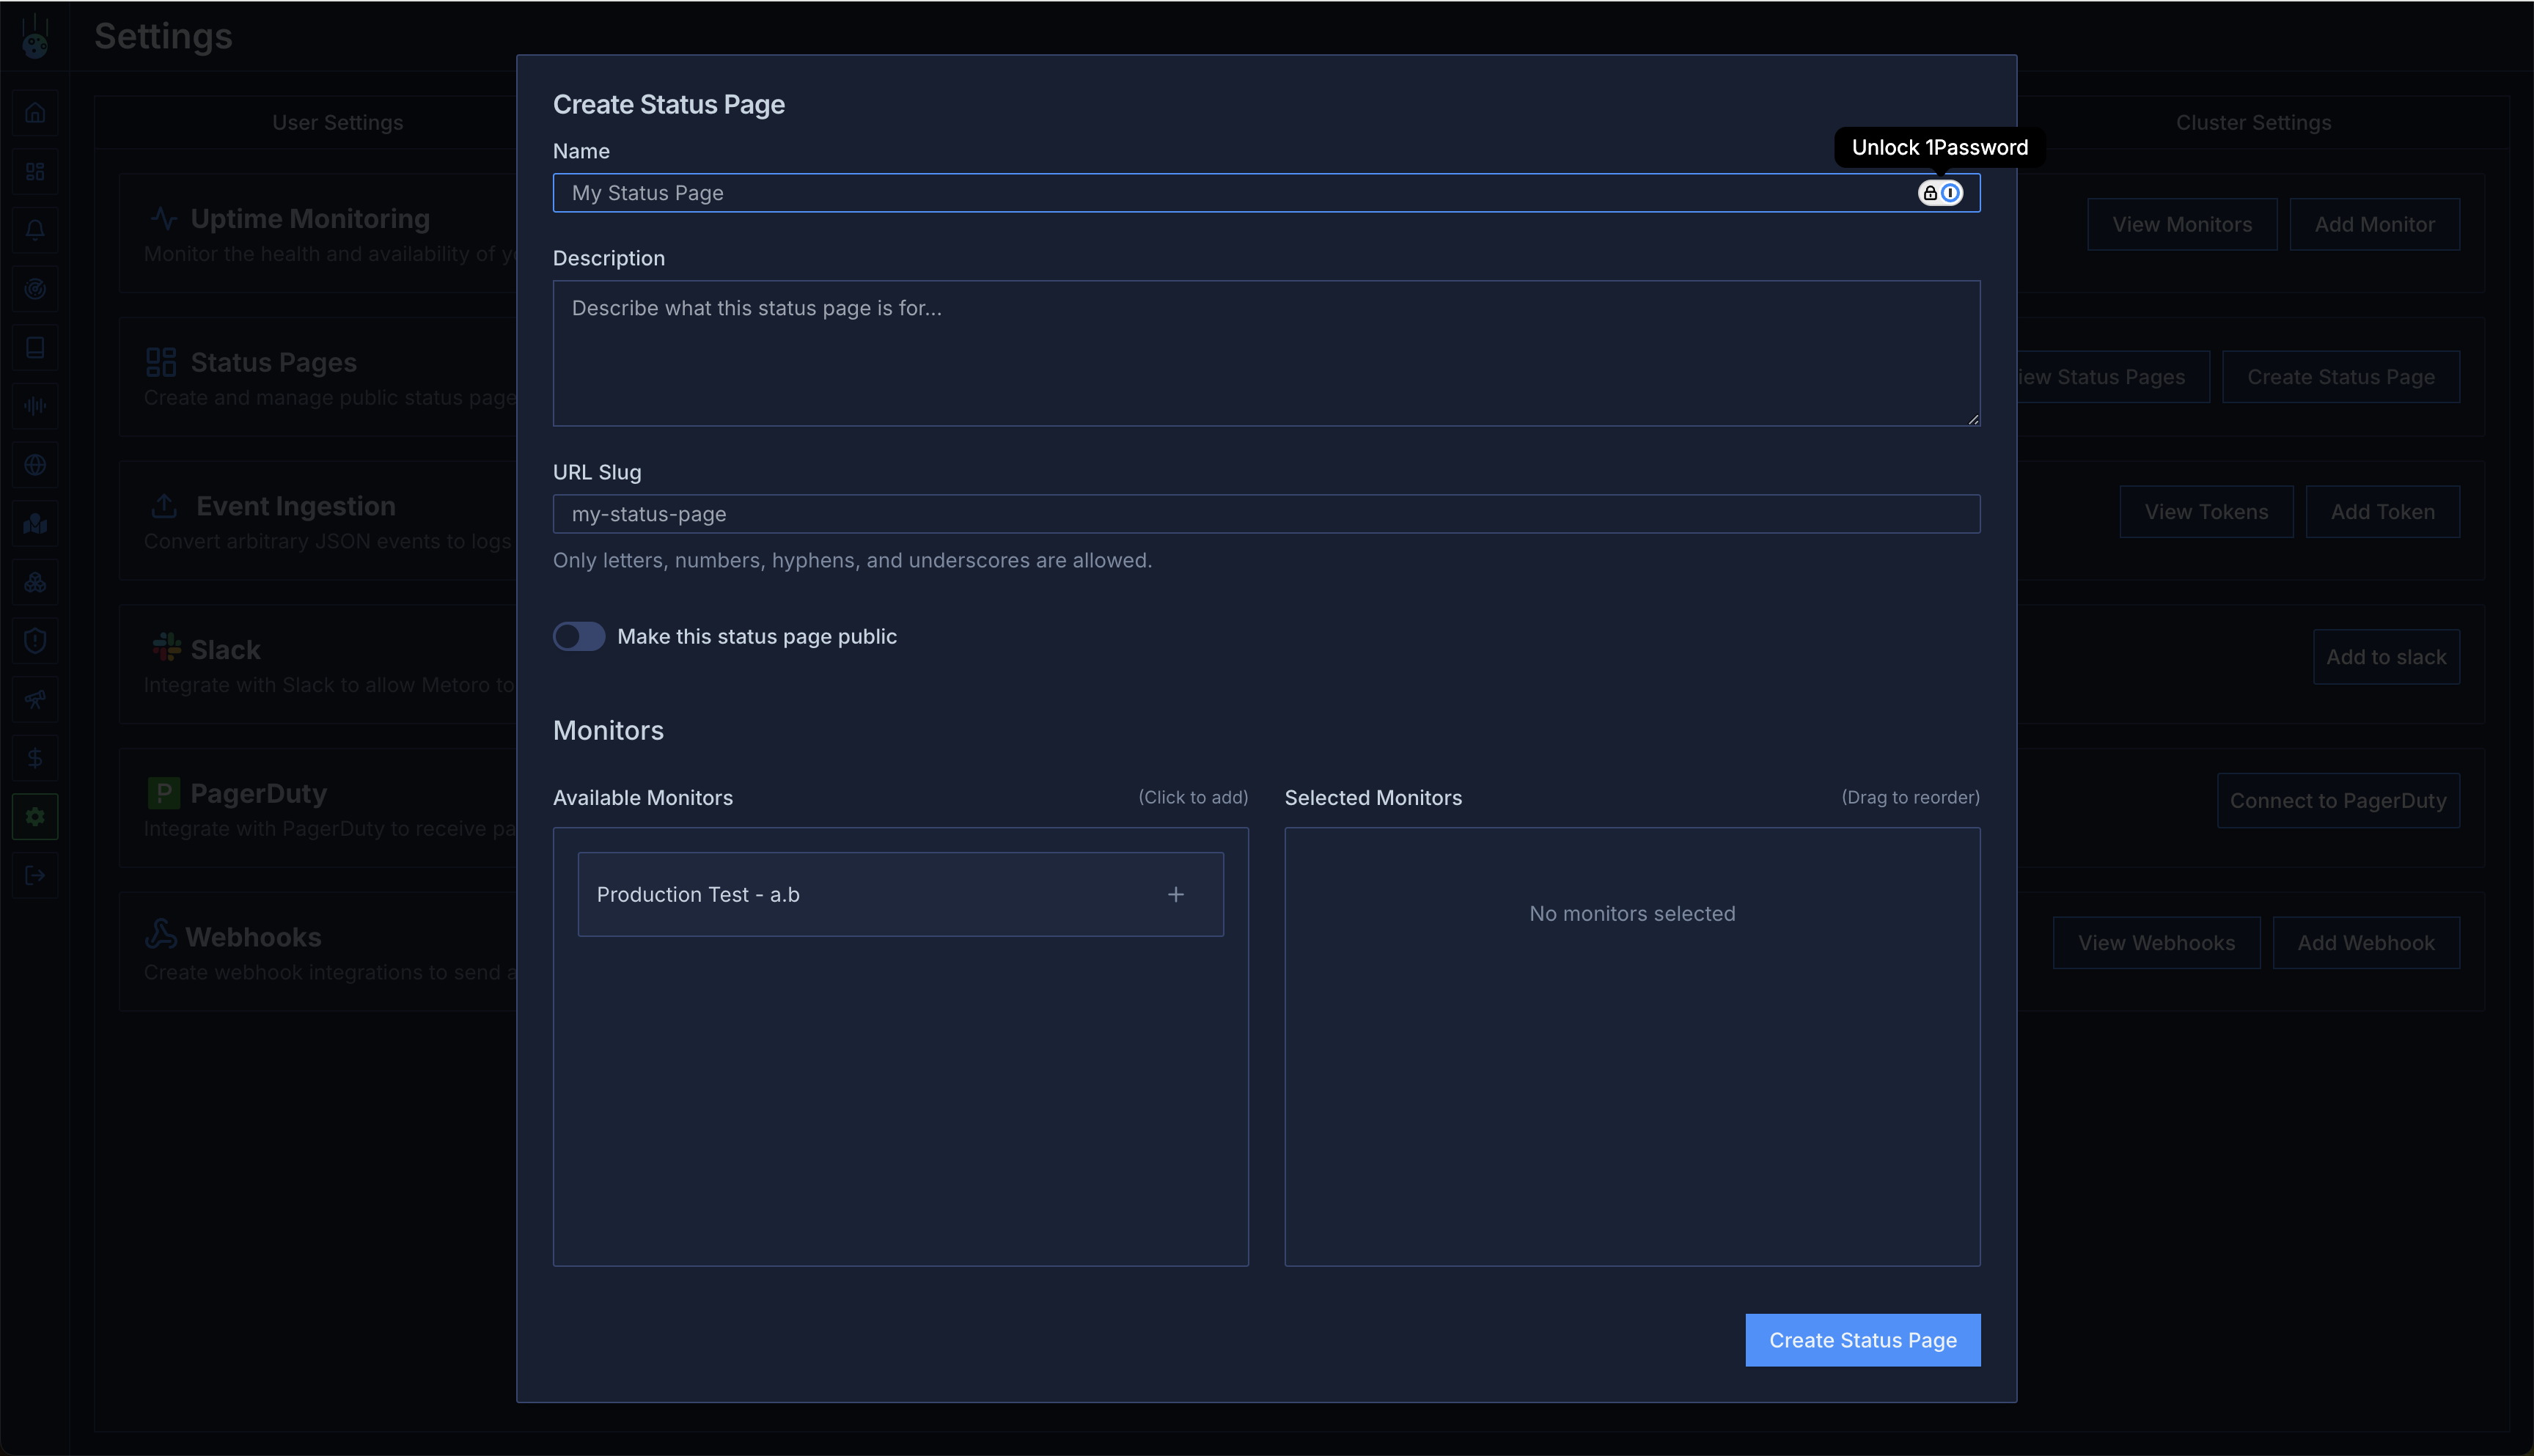
- Click “Create Status Page”
Configuration Options
- Name: A descriptive name for your status page
-
Slug: The URL-friendly identifier for your page (e.g.,
serviceX-status) -
Access: Choose between public or private access
- Public: Anyone with the URL can view the status page
- Private: Only authenticated users can view the page
- Latency Chart: Toggle the “Show latency chart” switch to surface response time trends beneath the uptime timeline on your public page
-
Monitors: Associate uptime monitors with this component
- Status will automatically update based on monitor results
- Multiple monitors can be assigned to a single component
Enabling the Latency Chart
To display latency alongside uptime results:- Create or edit a status page from Settings → Integrations.
- Enable the Show latency chart toggle in the form.
- Save your changes and ensure at least one assigned monitor has recent response time data (HTTP monitors record this automatically).